
Stop guessing which shows actually made money
A real P&L per stream, a 168-hour heatmap of when your audience buys, margin by category and SKU, and branded exports — all generated from sales the extension logged for you.
- Per-stream P&L after every cost
- 168-hour peak revenue heatmap
- Margin by category, SKU and bulk lot
- Branded PDF and CSV exports
3-Day Free Trial · 30 Logging Credits Included · No Card Required
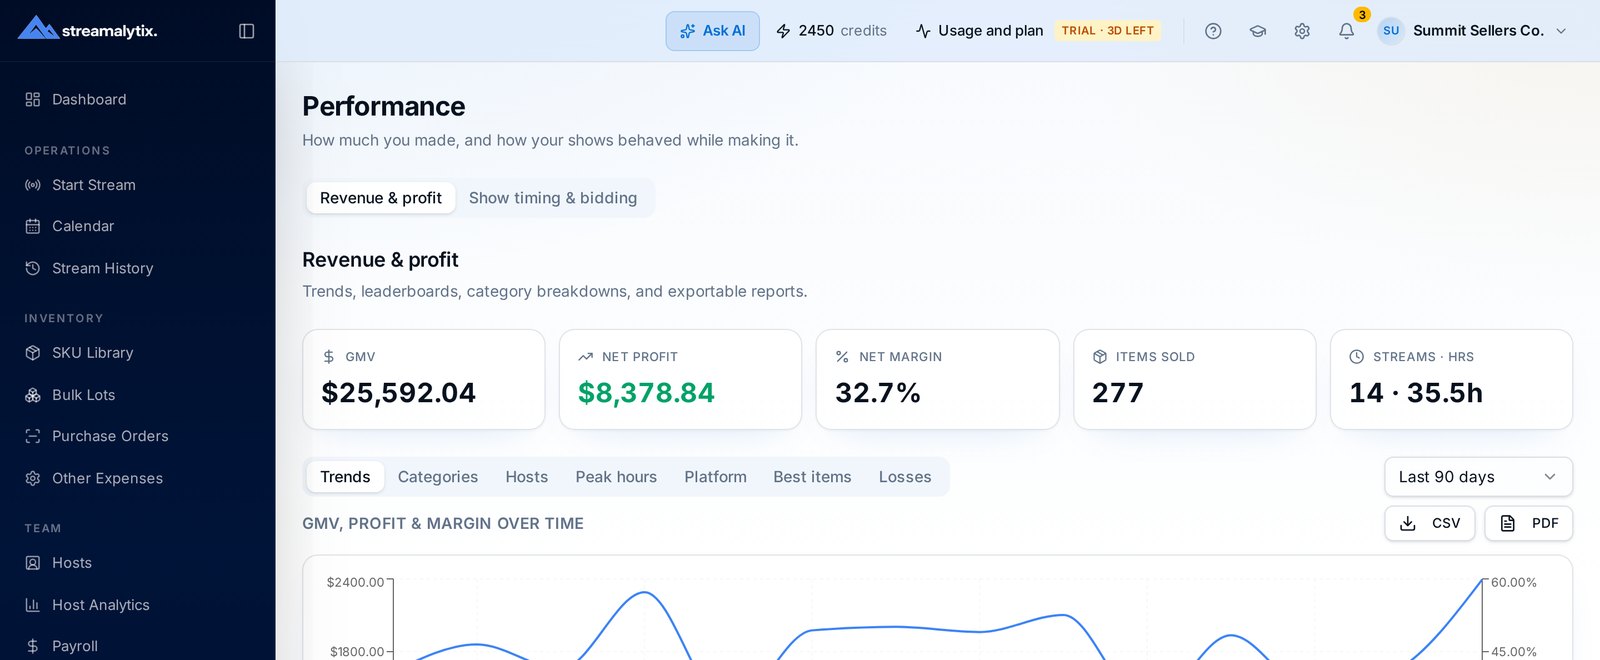
How a report gets built
You don't assemble anything — the show assembles the report.
- Step 01
Sales arrive costed
The extension logs items and matches each to a SKU or bulk lot, so every line already carries a cost basis and a visible cost source.
- Step 02
Costs are applied
Platform fees, shipping, host pay and your per-hour operating cost are layered on to produce net profit rather than gross revenue.
- Step 03
Insights accumulate
Across streams, patterns surface: best hours, best categories, best hosts, and which sourcing decisions are quietly losing money.
A P&L per show, not a revenue number you have to interpret
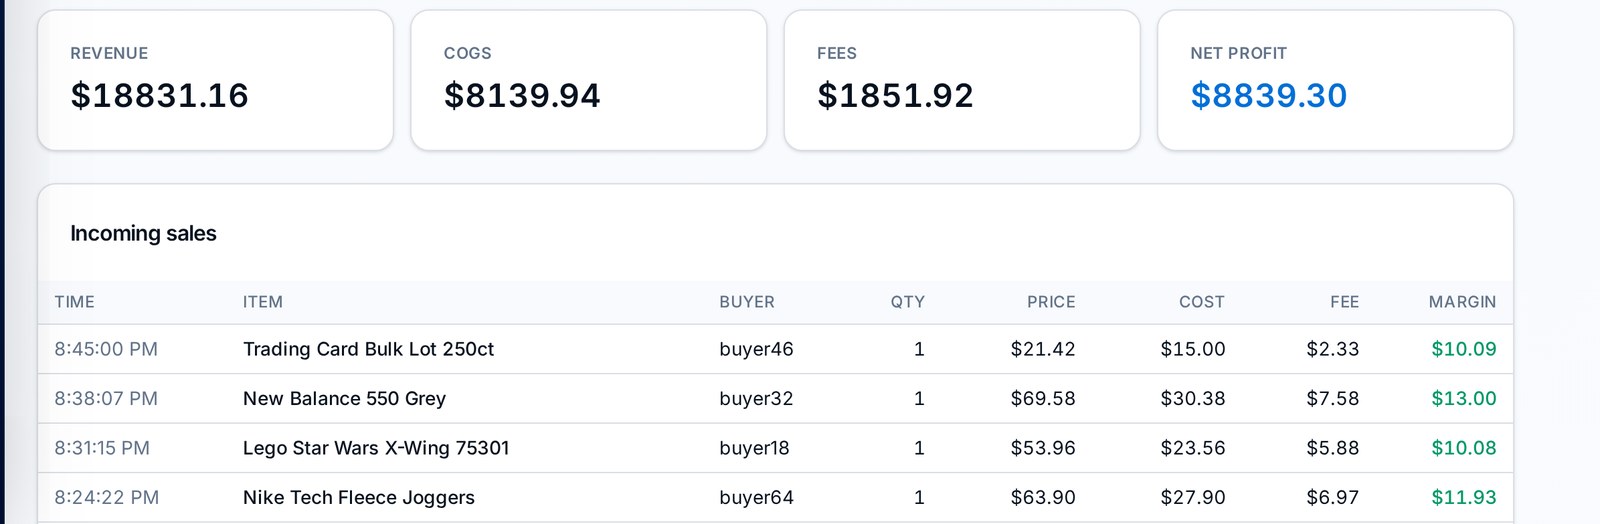
Revenue tells you almost nothing on its own. The stream report shows what the show cost to run and what was left, line by line, with every cost source visible so you can audit any figure.
- Revenue, fees, shipping, COGS, host pay and overhead
- Item table with listing, product, cost source, profit and margin
- Click any line to inspect or reassign its cost basis
- Export branded PDFs for partners, lenders or bookkeepers
Schedule and source using your own data
Generic advice about the best time to go live is worthless next to your own 168-hour grid. Product analytics does the same for sourcing decisions.
- Peak hour heatmap across the full week
- Category and SKU margin with sell-through
- Stream-over-stream trends for AOV, items/hour and margin
- Auction intel so opening prices are informed
The reporting surface in full
Peak hours heatmap
168 cells, one per hour of the week, ranked by revenue and profit from your own history.
Category margin
Which categories carry your business and which ones just fill airtime.
Product analytics
SKU and lot level sell-through and margin, so restocking is evidence-based.
Per-hour economics
Profit per hour on air, with your operating cost included rather than ignored.
Targets
Set profit and pace targets and see live and historical performance against them.
Exports
CSV for spreadsheets, branded PDF for anything you hand to another person.
Straight answers
If something isn't covered here, the team replies within a business day.
A per-stream P&L with revenue, fees, shipping, COGS, host pay and hourly operating cost, plus a line-by-line item table with cost source, profit and margin — exportable as CSV or a branded PDF.
See your last show as a real P&L
Log one stream during the free trial and the full report is waiting when you go offline.
